
Cost of living report
The cost of living crisis cost people an extra £441 in household bills, on average, in March 2023 compared to a year earlier.
Energy bills and cost of food
Almost nine in ten adults (89%) told us they are worried about energy bills and almost the same number (85%) are worried about the cost of food. This was a slight decrease compared to our research in both August and last February.
The number of people who describe themselves as very worried about rising bills this time round is lower than last August and February, at 22% compared to 27% and 32% respectively.
How the cost of living worries evolved between March 2022 and 2023
It's been over a year since UK households were plunged into the cost of living crisis, and we've been tracking how people have been coping ever since. Every six months, we survey a nationally representative group of 4,000 UK adults, allowing us to analyse trends across different demographics. Our third wave of research, carried out in March 2023, shows how worries and responses to rising costs have evolved in the last 12 months.
Energy bills were, and continue to be, a key concern for consumers over the last 12 months. But while typical energy bills have doubled since February 2022, consumer concern hasn’t followed suit. In fact, concerns peaked in August 2022 with over nine in ten (93%) people worried about their energy bills but have reduced slightly since then (89% in March 2023). Worries are likely to have been further alleviated following the news that the Energy Price Guarantee, which currently limits the energy bill of a typical household to £2,500 a year (or £2,109 in Northern Ireland) would be extended until 1 July. That announcement came after we carried out our survey.
Despite the fact that the cost of living crisis has been with us for over a year, people seem less worried about rising food and fuel costs. Instead, their concern has shifted to housing costs. The Bank of England increased base rates to 4% in February 2023 (and has raised them again since), but this rise was compounded by the fact that new fixed rate mortgage deals rose sharply after last year’s mini-budget. Borrowers on a variable rate had seen their mortgage payments rise since the Bank started increasing the base rate in December 2021. However, those whose fixed rate mortgage came to an end faced the shock of a steep increase in their monthly mortgage payments if they chose a new fixed rate deal or moved onto their lender’s standard variable rate.
Mortgage worries
The number of people who said they are worried about mortgage costs more than doubled from last year, rising from 34% in August 2022 (and 35% in February 2022) to 77% in March 2023.
This was reflected in the fact that the number of people who said they are worried about mortgage costs more than doubled - from 34% in August 2022 (and 35% in February 2022) to 77% in March 2023, while the number of people who said they are worried about rental costs increased from 41% in August to 83% in March.
We have been able to react to trends and findings in earlier surveys and add questions to explore areas of interest. In August, for example, we asked people whether they were in financial crisis (which we defined as not being able to pay basic household bills). The number of people who describe themselves as being in financial crisis, or close to it, was consistent between the two waves of research (in August, 6% said they were in financial crisis and 14% said they were close to it, compared to 5% and 14% in March).
However, there are some significant differences across the demographics. Younger people (aged 25-34) were twice as likely to describe themselves as being in financial crisis (women aged 18-24 and men aged 25-34 were four times more likely to do so). People who are working long hours (over 56 hours a week) were also more likely to say they were in financial crisis (22% reported this). But one of the biggest indicators was whether or not people had savings.
In August, we asked people about their ability to cope with an unexpected bill and found that approximately one in three could only afford an unexpected expense of up to £500 from income or savings.
We explored this further in our latest research, repeating the question about unexpected bills, but drilling down into how much savings people have; where their savings are kept; what they have been earmarked for and how much of their savings they’ve used to help pay for the cost of living.
The average that people told us they have in cash savings is £12,240, but within that, a significant percentage have little or no buffer. One in five (20%) have less than £100 in savings, while over one in four (27%) have less than £500.
One in six of our survey (16%) say they have no savings at all, and 44% of those reported that they are either in financial crisis (14%) or close to it (30%).
Not surprisingly, some of those who have savings have been dipping into them to help them to pay for rises in the cost of living. One in five people (21%) told us they have used some or all of their savings and 18% of these have used between £2,000 and £5,000 of their savings.
The ‘kids and pets’ demographic
We know that people have been facing higher costs across a range of household bills, and our survey found that consumers have been paying an average of £441 a month extra on household bills in the last 12 months. This figure varies according to a range of demographic factors, such as where people live, their income levels, age and whether they have children or pets. In fact, our research shows that those with children and pets faced the highest rise in household bills, at £497 a month, on average.
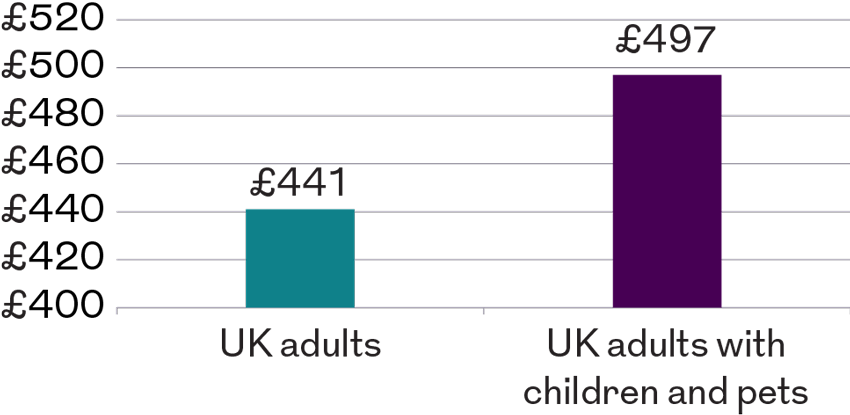
This demographic, which makes up an estimated 16 million UK households, experienced an annual rise in household bills of £5,960 – over £800 more than for those who don’t have children or pets. Increases in the cost of childcare (£97 a month) and pets (£68 a month) combined were more than the average increases in energy bills (at £141 a month).
Those with children have also been working longer hours to help pay for bills, with two in five (39%) people with children aged up to three years old working 56 hours a week or more, and one in three with children aged between seven and ten years old.
People who are expecting a child, or who have children, are more likely to have taken on an additional job to help with rises in the cost of living than those without children (51% of those expecting a child, and between 31% and 38% of those with children aged up to 10 years compared to just 9% of those without children).
People with children are also far more likely to be worried about loans or other debt (between 69% and 77%, for children aged up to ten, depending on the age of the child, compared to 40% for those without children). And those who are expecting a child or who have a young child, aged up to ten, are far less likely to have money left over at the end of the month than people who don’t have children (22% versus 43% reported having money left over).
According to the Organisation for Economic Co-operation and Development (OECD), the UK is the third most expensive country in the world for childcare, after New Zealand and Switzerland. Although the UK Chancellor, Jeremy Hunt, announced in his recent Budget that 30-hours-a-week of free childcare will be extended to working parents of children aged nine months to four years in England (with funding announced for schemes elsewhere in the UK), this plan won’t fully come into effect until September 2025.
Higher earners under pressure
Although an annual income of £40,000 to £80,000 should help insulate people from the cost of living rises, more higher earners reported finding themselves either overdrawn or having to borrow (35% versus 31%) at the end of the month compared to the sample as a whole.
The higher earners paradox
We know that people on a lower income spend a higher proportion of it on essentials, such as energy bills and food, and so have been particularly hard hit by the cost of living crisis. However, we also wanted to explore how people on a higher income have been affected and how they are responding to the higher costs.
Our research found that people earning between £40,000 and £80,000 have seen monthly outgoings shoot up by £560 a month in the 12 months to February, compared with the average person’s increase of £441 — a difference of 27%. Interest rate rises, food inflation and energy costs were all significantly higher for those earning £40,000 to £80,000 a year. For example, the increase in housing costs among this group is currently outpacing the national average by 17% - or £244 versus £208 a month.
A higher income may mean higher heating bills as well. The same demographic saw average monthly energy bills rise by £155 compared with a national average of £141, a difference of 10%. Grocery bills for the £40,000 to £80,000 income bracket are also rising faster than the average household (£144 versus £122 a month).
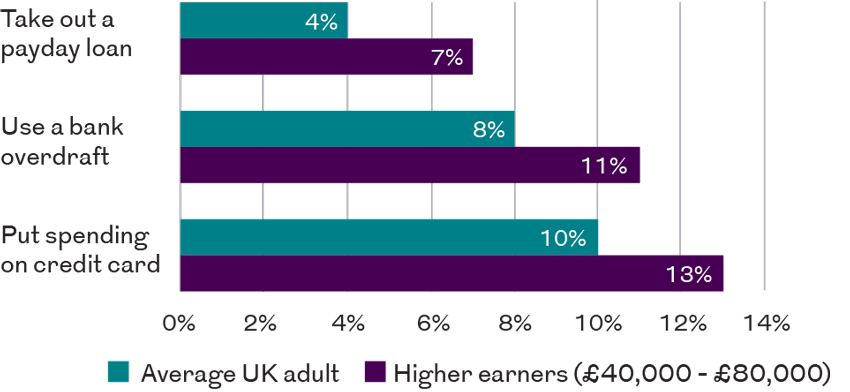
Although an annual income of £40,000 to £80,000 should help insulate people from the cost of living rises, more higher earners reported finding themselves either overdrawn or having to borrow (35% versus 31%) at the end of the month compared to the sample as a whole. They are also more likely to put more of their spending on their credit card (13% v 10%), use a bank overdraft (11% v 8%) or take out a payday loan (7% v 4%) to help cover future increases in the cost of living.
One in six (16%) of those earning £40,000 to £80,000 a year have already used some or all of their savings to help pay for rises in the cost of living (compared to one in five – or 21% of UK adults).
Although higher earners have a higher level of savings than the sample as a whole (£14,446 versus £12,240), those who have dipped into their savings have done so to a greater extent than the national average (£2,690 versus £2,221), and it is, perhaps, surprising that one in five (19%) of those earning £40,000 to £80,000 a year say they could only afford an unexpected expense of up to £500, compared to 29% of UK adults.
While it’s fair and understandable that government help with the cost of living will be more targeted at those on the lowest incomes in the future, people on a higher income may be less financially resilient than we might assume; especially if interest rates continue to rise or take time to reduce.
Pensions and the cost of living
The number of people stopping or reducing their pension contributions is still relatively low, and people are far more likely to focus on making changes to their day-to-day spending (such as eating out less, buying fewer clothes, buying less food and/or buying cheaper food) than they are to stop paying into their pension.
Pensions and protection – who’s making cutbacks?
Over the last year we have tracked how the cost of living crisis is affecting people’s ability to save for their retirement, and the picture has been fairly consistent.
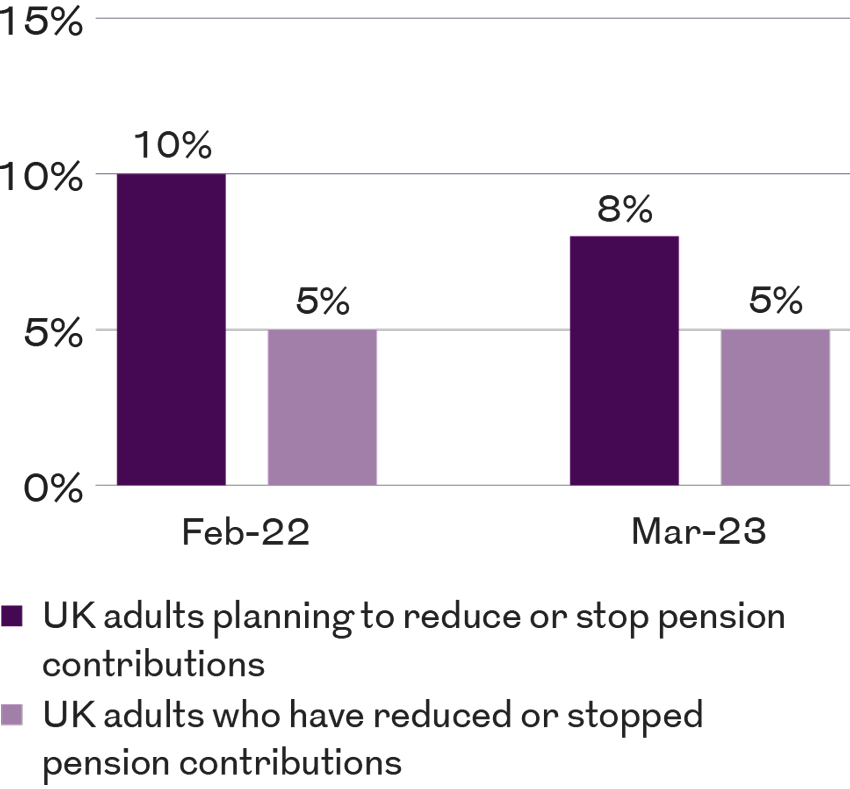
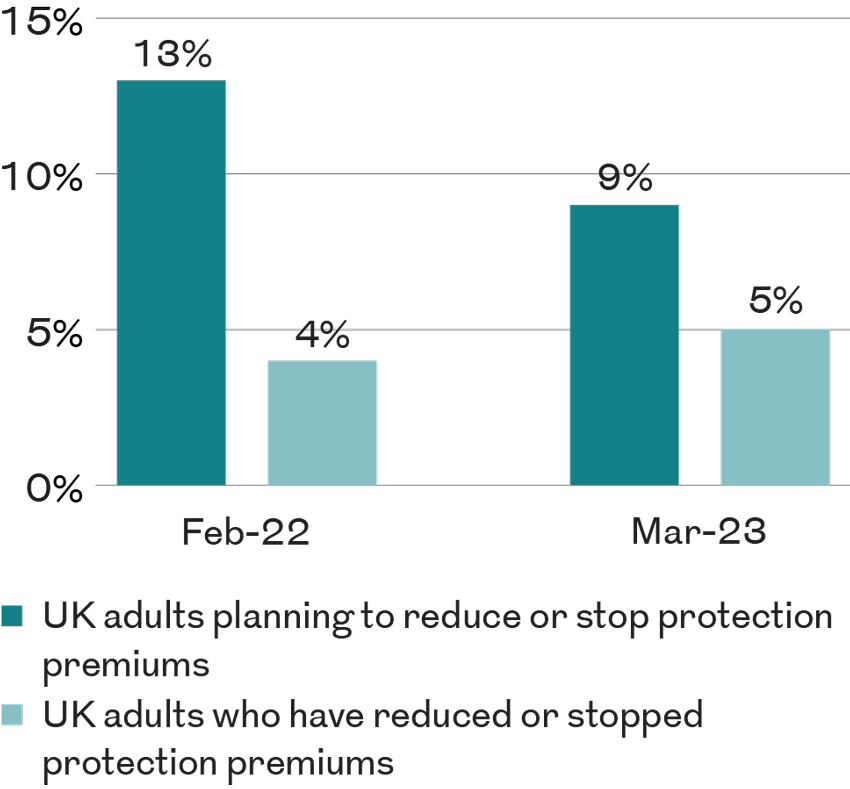
In our latest research, one in twenty people (5%) say they’ve already reduced or stopped their pension contributions to help pay for the cost of living (same as in February 2022) and the same percentage say they’ve reduced or stopped their protection premiums (compared to 4% in February 2022).
When we asked people what steps they plan on taking to help cope with future cost of living increases, almost one in ten (8%) said that they planned to reduce or stop their pension contributions. This might lead us to think that more people will stop paying into their pension in the future, than currently do. However, if we look back to February 2022, one in ten (10%) people told us that they planned to reduce or stop their pension contributions – but only half that number actually did.
Some groups were more likely to say they will stop or reduce their pension contributions; for example, people aged 25-34 (where 8% say they plan to stop their pension contributions and 9% plan to reduce them); those expecting a child (14% plan to reduce and 13% to stop pension contributions) and those with a young child aged up to six, where 8% plan to reduce and 7% to stop pension contributions.
Not surprisingly, a higher percentage of people in financial crisis plan to reduce (8%) or stop (11%) pension contributions, with slightly more of those who are close to financial crisis (11% and 10%) looking to make cutbacks or stop contributing to their pension altogether.
The two key takeaways from this are that the number of people stopping or reducing their pension contributions is still relatively low, and people are far more likely to focus on making changes to their day-to-day spending (such as eating out less, buying fewer clothes, buying less food and/or buying cheaper food) than they are to stop paying into their pension. The second insight is that more people say they plan to reduce or stop their pension contributions than actually do so.
Out of those who are planning to reduce or stop their pension contributions, almost half (47%) haven’t assessed the impact of doing this on their retirement income.
For some people on a tight budget, pausing their pension contributions may be the right thing to do. However, estimates show that 12 million people, or 38% of the working population, are not saving enough for their retirement.
We saw a similarly low number cancel or reduce their protection premiums, but the reasons for doing so were varied. Almost half of people said they could no longer afford it (45%), while 37% said it was too expensive. However, one in five (21%) said they were cancelling their protection policy because they had enough savings. Looking at this group in more detail, one in five currently has a mortgage and one in four (26%) only has between £250 and £1,999 in savings, so cancelling their protection policy could leave them exposed.
We know that people are making some very tough decisions about their spending, but by cancelling protection or making pension cutbacks today, there is a concern that some people may be leaving themselves financially vulnerable to the effects of a life shock, such as ill health, or increasing the risk of facing a cost of living crisis in later life.
Cost of living: October 2023
6 months after this report was created, we have updated our survey to understand the impact the Cost of Living crisis is still having on UK households.
In October 2023 Cost of Living continues to be the biggest worry for UK consumers with 94% of those surveyed stating to be concerned by it. For more up to date insights view our latest data here.